Alarm – Driving without tacho card
alerted when driver is driving without his driver card inserted into the tachograph.
Alarm – Driving & resting times
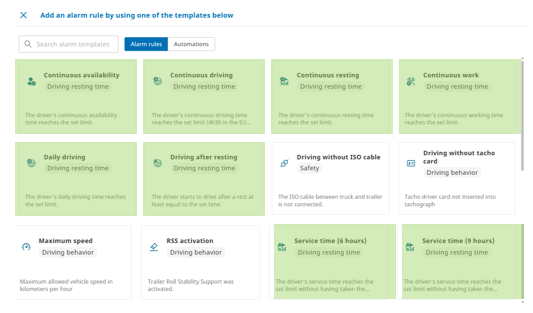
Get alerted on available driving times per driver.
Manufacturer reports (for trailer OEs)
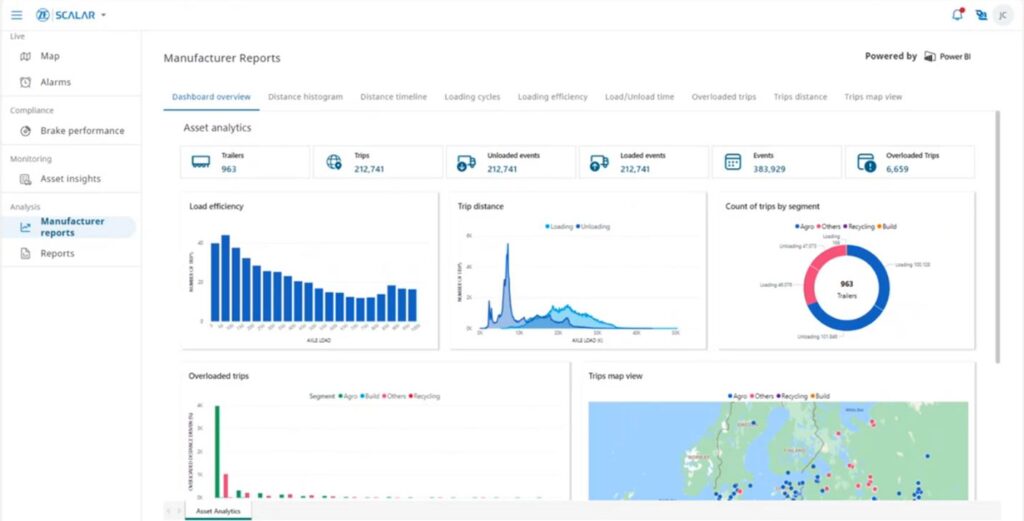
Specifically developed for trailer manufacturers, this POWER BI dashboards includes multiple reporting tabs: Dashboard overview Distance histogram Distance timeline Hydraulics usage: PHASE 2 development Loading cycles Load/Unload time Overloaded trips Steering axle status: PHASE 2 development (will be renamed as ‘Lift axle status’ !!!) Trips distance Trips map view Please be informed NO detailed […]
Report – ECO
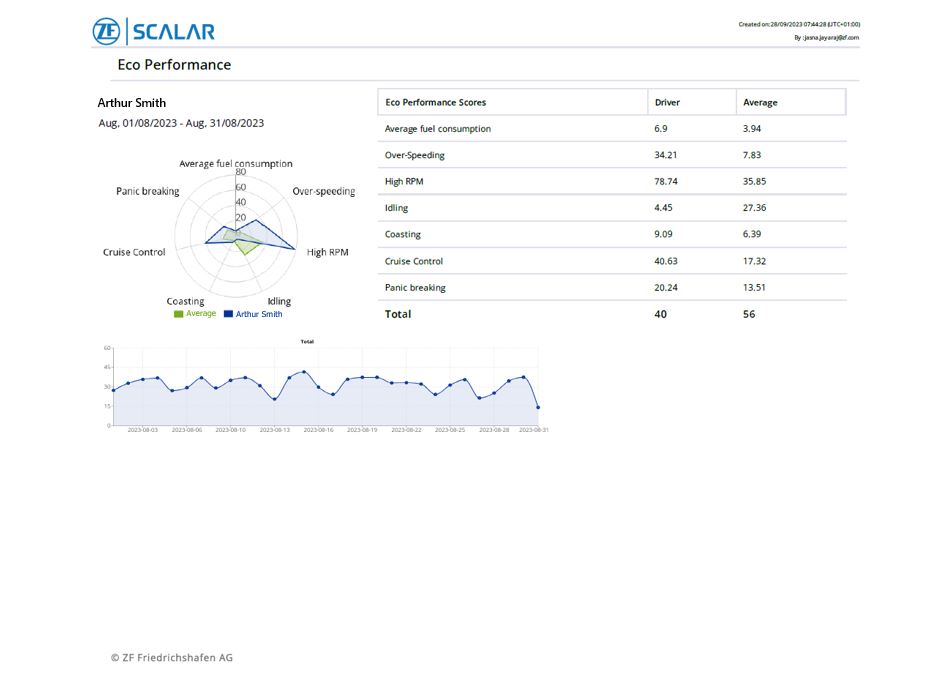
of ECO Performance scores.
Report – Driving with stop
This report shows a line per stop, with some extra information of the stop and the driving that preceded it. A stop is defined by either a shift in x kg axle load, or by a driving larger than y and a standstill larger than z. This report can be generated per vehicle or […]
Report – Consumption
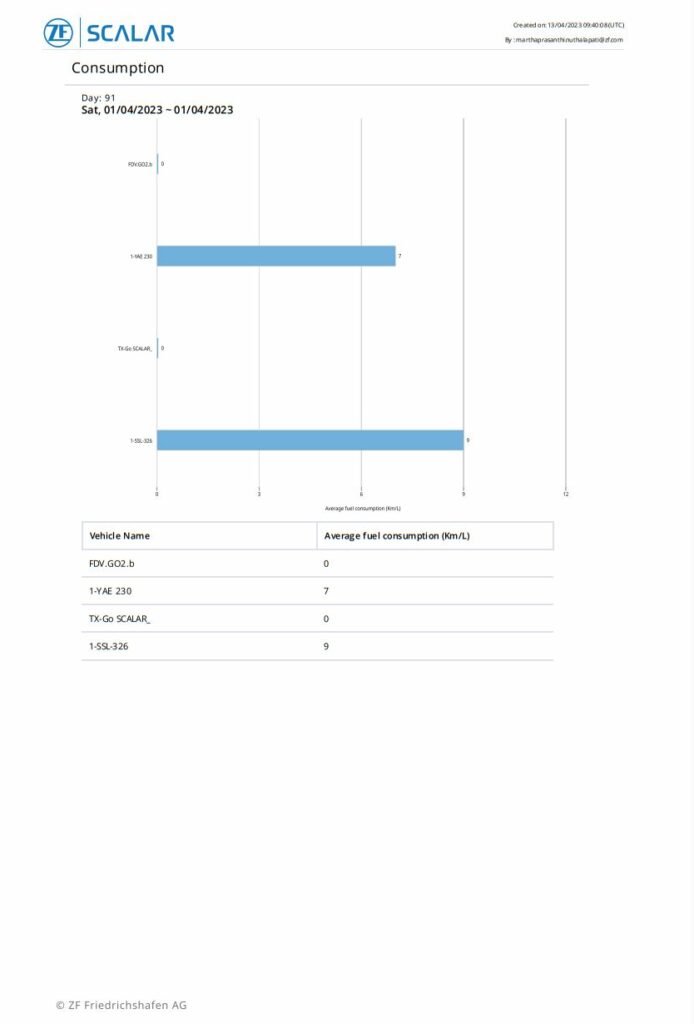
of fuel consumption.
ODR (Operating Data Recorder)

and periodical read-out of ODR files by means of the ODR file “Decoder”
Notes on Assets
feature allows dispatchers to add, treat and resolve kind of “sticky notes” with any kind of information linked to a specific asset. Users can choose whether the notes are visible to everyone or only to themselves. This is a migration feature.
TPMS monitoring
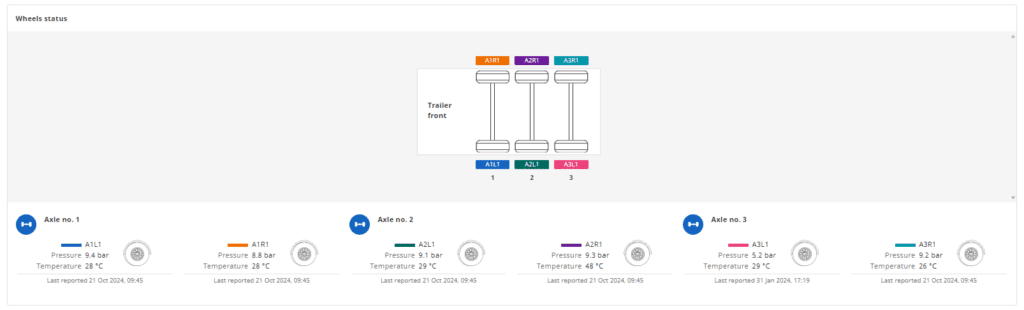
List view: Last-known tire pressure: red-amber-green icon indicating tire location and problem severity “Chart displays”, visualizing data 6 up to by default 48 hours in the past with possibility to hover over chart line for detailed info: Tire pressure and tire temperature history “Wheels status” drawing: visualizing last-known tire pressure and temperature per tire
Trailer insights – EBS (Electronic Braking System)
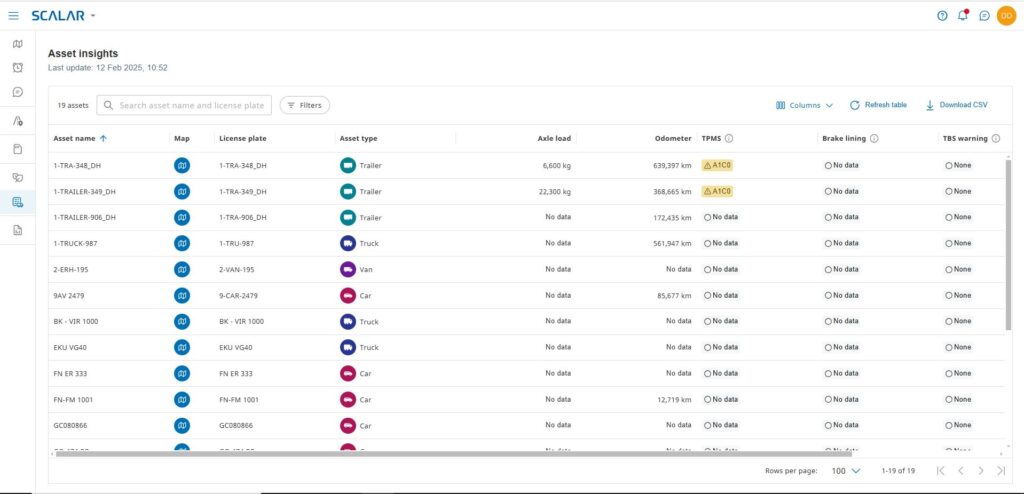
data from major EBS brands and types (WABCO, KNORR, HALDEX) Output visualized in module “Asset insights” , including – amongs others – odometer, axle load, warning lamps, brake lining, etc.