Route planner – basic
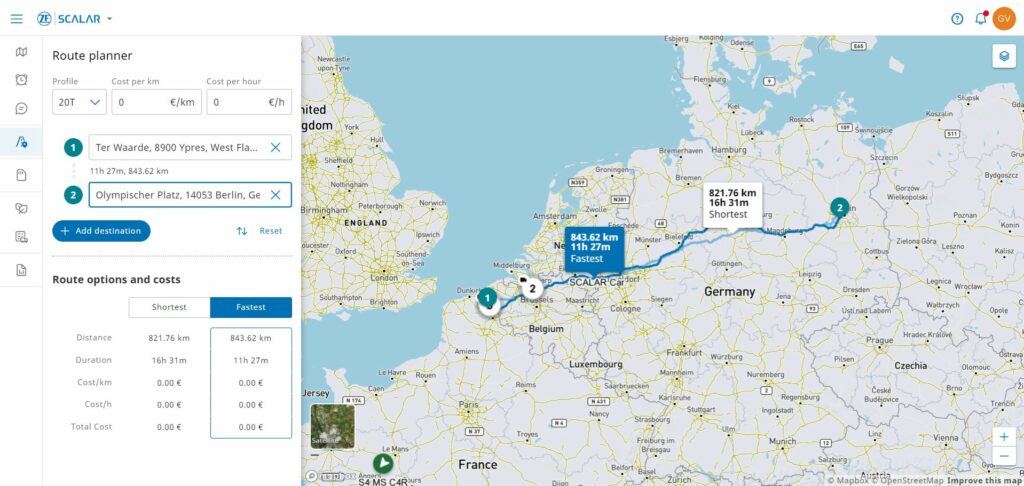
Route calculator, considering Start point (this could also be the current location of the asset), end point and via-points Different vehicle profiles Cost/hour/km The calculated route includes Route visualization on map with comparison table : fastest route versus shortest distance
Report – Distance
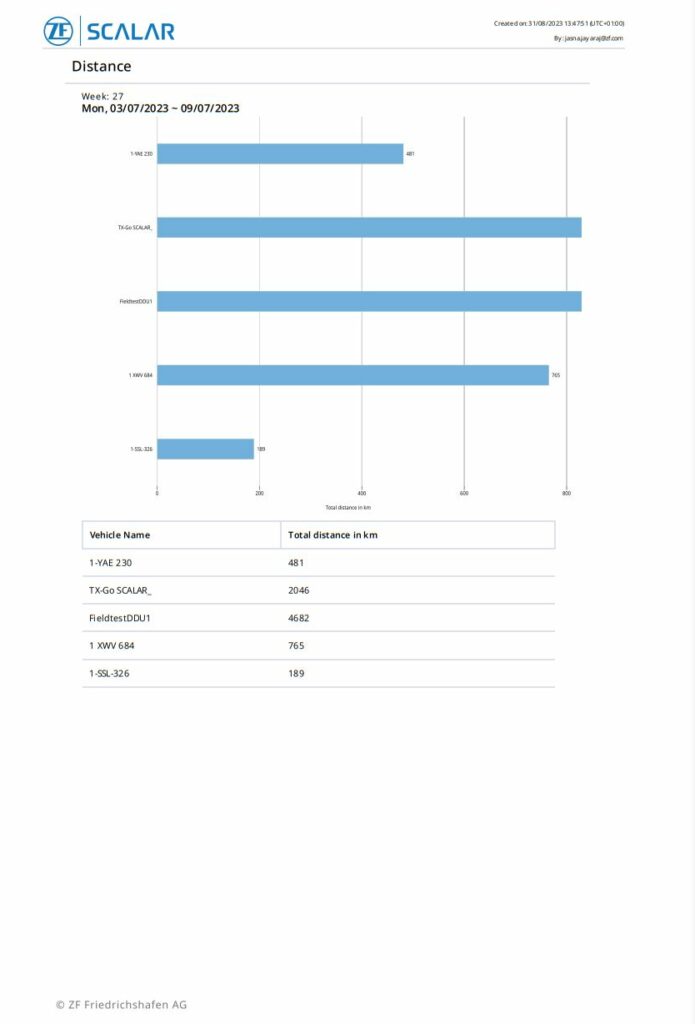
Overview of distance travelled.
Report – Alarms
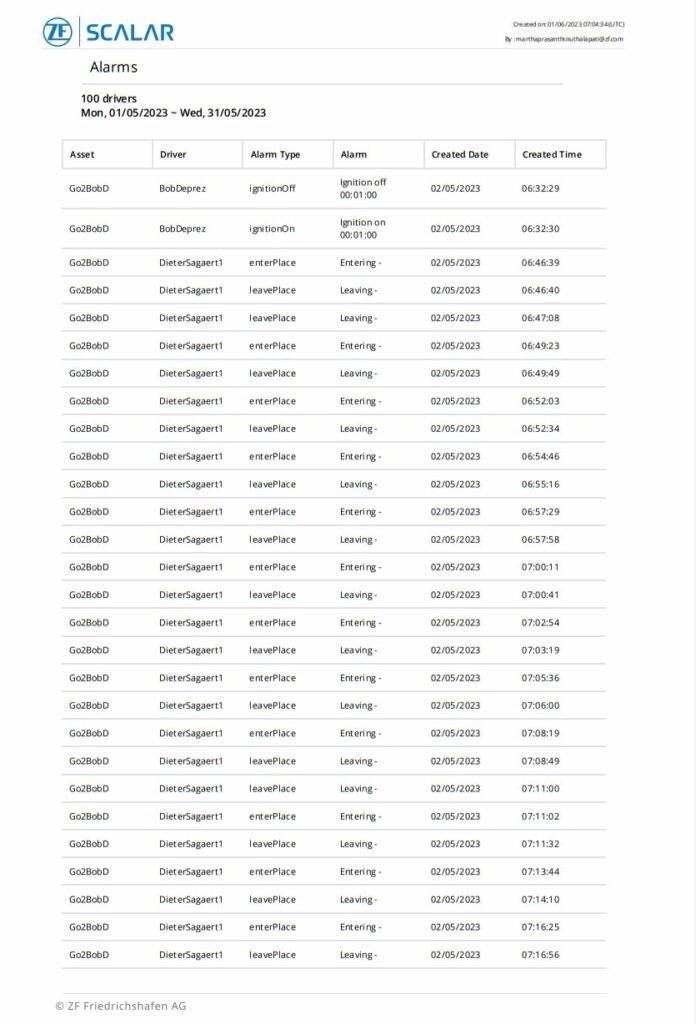
Overview of all alarms.
Report – Activity
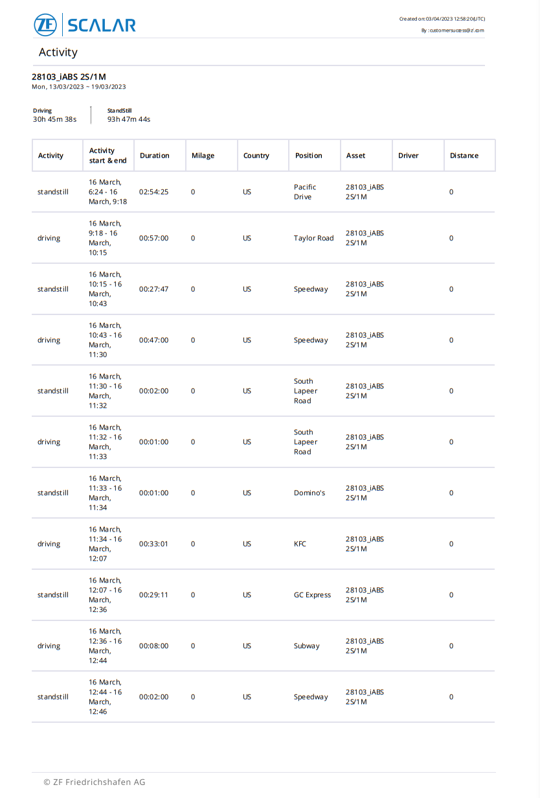
Overview of activities – driving & standstill.
Live tracking
Live tracking of assets on map & list view. This includes: Current asset location Activity overview as registered by connectivity device : driving & standstill Visualize route on map (last 24 hours only)
Historical tracking
Historical view on activities and routes View historical route on map
Geofencing
Create Geofences and related alarms. This includes: Manually add new place (point of interest) in SCALAR Web app. Assign team(s) & user(s) to place in SCALAR Admin. Edit place in SCALAR Web app. Make geozones optional while creating a new place. Add alarms in relation to place See places or points of interest on map […]
Manage “Assets”
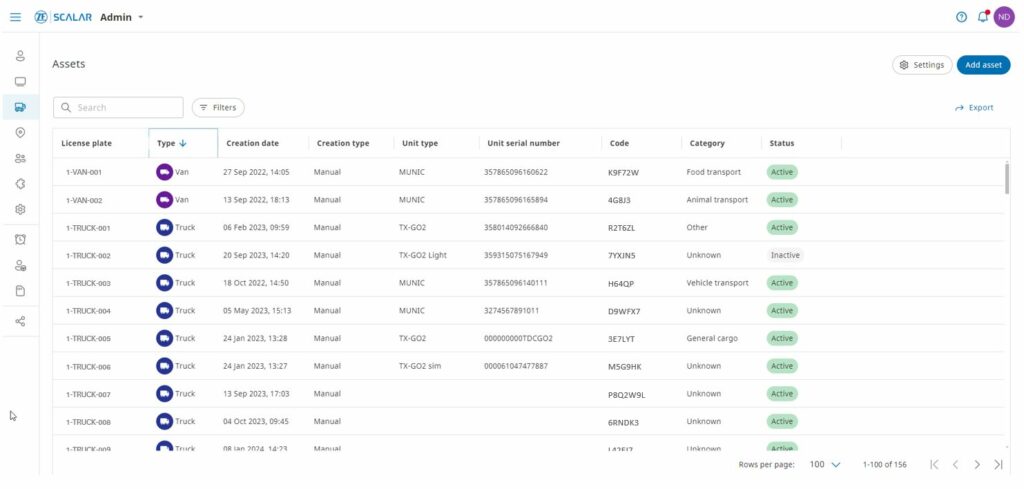
In the “Assets” module, one can manage assets, including – Manually add new asset in SCALAR Web App – Assign team(s) & user(s) to asset from SCALAR Admin – Manually edit asset in SCALAR Web app – Mark inactive asset in SCALAR Web app – Search & filter connected assets Specifically for trailer device: – […]